
Last Updated: November 9, 2026
Quick Summary
Evaluating water usage in flower production means measuring water applied minus runoff and drainage to find water consumed by the crop, then dividing by stems harvested to get gallons per stem. A practical audit takes about a day to set up and one full production cycle to produce trustworthy data. Log applied water, runoff, and harvest counts weekly to find your biggest losses.
- Install a flow meter on the main line and a submeter on each irrigation zone.
- A spread wider than about 10% between catch cans points to clogged emitters or pressure loss.
- A zone applying 1,000 gallons, capturing 200 in runoff, and harvesting 400 stems uses 2.0 gallons per stem.
- Recirculating irrigation captures runoff and returns it to the crop, the biggest water saver for greenhouse production.
- Filter and test recycled water, since it can carry plant pathogens.
Table of Contents
- Why Water Measurement Matters on a Flower Farm
- The Flower Production Water Use Formula
- Measuring Irrigation Water Use with a Practical Audit
- Water Applied Versus Water Consumed
- Water-Use Efficiency in Flower Production
- Comparing Water Use by Crop, System, and Climate
- Water Reuse, Recirculation, and Runoff Management
- Starting Your Water Use Evaluation
- Frequently Asked Questions
Why Water Measurement Matters on a Flower Farm
Evaluating water usage in flower production starts with a simple truth: you cannot manage what you never measure. Water is a crop input with a real cost, not an afterthought.
The stakes are bigger than one farm's bottom line. According to the USDA Economic Research Service's irrigation data, farms with some form of irrigation accounted for more than 50% of total U.S. agricultural production value. Water is a business asset.
Here is what most growers get wrong: they track fertilizer and seed costs to the penny but guess at water. Below, we show you how to measure, calculate, and cut water use without sacrificing quality.
The Flower Production Water Use Formula
The flower production water use formula is simple: water applied minus runoff and drainage equals water consumed by the crop. That gap is where efficiency lives.
Here is the basic calculation:
- Water applied: gallons delivered through irrigation
- Water losses: runoff, drainage, and evaporation
- Water consumed: what the plants actually use
- Water per stem: total consumed ÷ stems harvested
Track these numbers per bed, per week. A grower applying 1,000 gallons and capturing 200 in runoff has 800 gallons of crop water. That 20% loss is the first place to look for savings.
The core calculation rests on a few tracked figures that turn gallons into a per-stem number.
| Item | Definition | Example figure |
|---|---|---|
| Water applied | Gallons delivered through irrigation | 1,000 gallons |
| Water losses | Runoff, drainage, and evaporation | 200 gallons captured in runoff |
| Water consumed | What the plants actually use | 800 gallons |
| Water per stem | Total consumed ÷ stems harvested | 2.0 gallons per stem |
Measuring Irrigation Water Use with a Practical Audit
Measuring irrigation water use means putting a number on every source and every loss. A practical audit takes about a day to set up and one full production cycle to produce trustworthy data.
Start with a flow meter on your main line. In a 2026 Greenhouse Management irrigation survey, growers named root health (60%) and algae growth (47%) as their biggest irrigation problems.
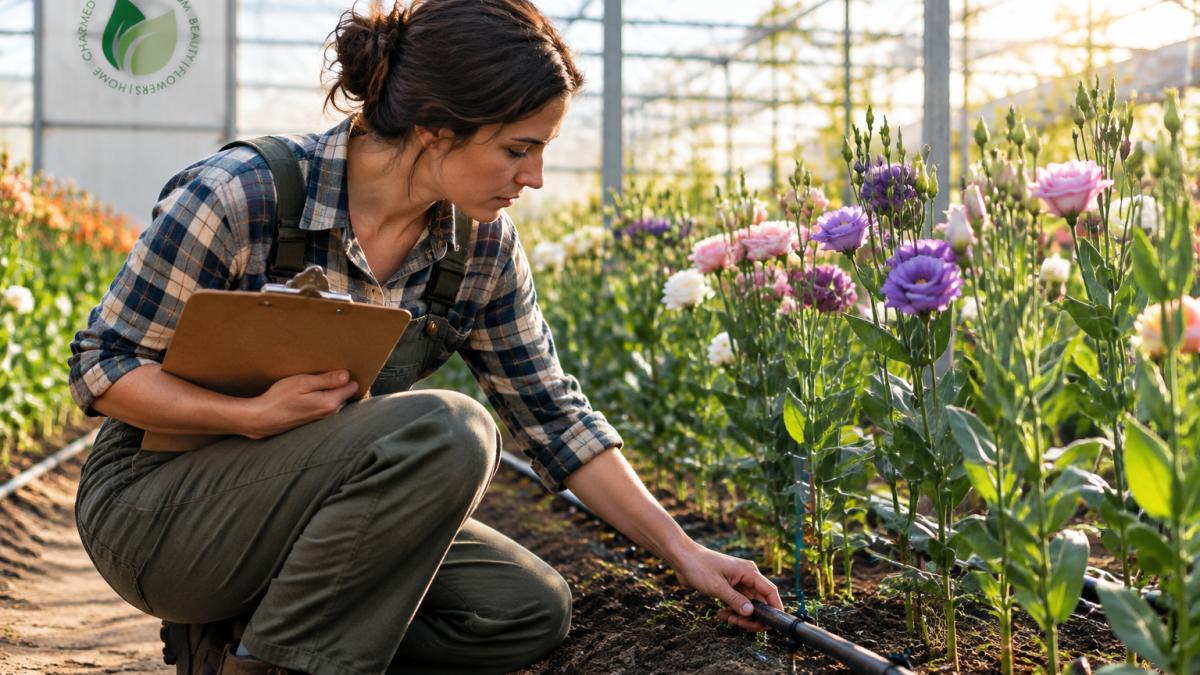
Step-by-Step Water-Use Audit
- Meter the source. Install a positive-displacement or turbine flow meter on the main line and a submeter on each irrigation zone. Record the meter reading and the date at the start and end of every irrigation event, in gallons.
- Log applied water per zone. Multiply emitter flow rate (gallons per hour) by the number of emitters by run time (hours). For overhead booms, use the meter reading directly. Keep the log in gallons per zone per week.
- Measure runoff at drainage points. Place a calibrated container or a small weir at each drain outlet and time the capture. Convert to gallons per week per zone. This is the number most growers skip.
- Check distribution uniformity. Run a catch-can test on a representative bed: set identical containers at the near, middle, and far end of a drip line or boom pass, run a timed cycle, and compare volumes. A spread wider than about 10% between catch cans points to clogged emitters, pressure loss, or uneven spacing.
- Record crop and container data per bed. Note species, container size (in gallons or inches), growing media, and planting date. These variables drive how much of the applied water the crop can actually use.
- Calculate water per stem. Divide gallons consumed (applied minus runoff and drainage) by stems harvested for the period. Do this per crop, not per farm.
- Reconcile monthly. Compare meter totals against the sum of zone logs. A gap larger than a few percent means a leak, an unmetered hose, or a logging error.
A common mistake is skipping the runoff measurement, which is often the fastest place to find savings because it requires no change to the crop plan.
Watch out: a flow meter installed on a line that also feeds a hose bib or a washdown station will overstate irrigation applied, so isolate irrigation lines before you start logging.
Turning Audit Data into a Water-Use Worksheet
A reusable worksheet keeps the audit honest across seasons. Build one row per zone per week with these columns: gallons applied, gallons of runoff, gallons consumed (applied minus runoff), stems harvested, and gallons per stem.
Worked example: a zone applies 1,000 gallons in a week, captures 200 gallons at the drain, and harvests 400 stems. Consumed water is 800 gallons, or 2.0 gallons per stem.
Keep the worksheet in a spreadsheet with one tab per crop and a summary tab that rolls up gallons per stem by month. The summary tab is what you compare year over year, and it is what turns an audit into a management tool rather than a snapshot.
Water Applied Versus Water Consumed
Water applied is what leaves your spigot. Water consumed is what the plant actually takes up and transpires. The difference is pure loss.
Many growers assume these numbers match. They rarely do. Evaporation, drainage, and runoff eat the gap. Container type and growing media change how much water a plant can hold and how fast it drains.
So track both figures separately. When applied water climbs but consumed water stays flat, you have a leak, an overspray problem, or a scheduling issue. Fix the loss before you touch the crop plan.
Water-Use Efficiency in Flower Production
Water-use efficiency in flower production is the ratio of crop output to water consumed. Higher efficiency means more stems, more biomass, or more dry weight per gallon.
Measure it three ways:
- Stems per gallon: harvest count ÷ gallons consumed
- Biomass per gallon: dry weight ÷ gallons consumed
- Water per stem: gallons consumed ÷ stems harvested
Container production and greenhouse production usually beat field production on efficiency because you control every input. But efficiency only improves if you measure it. Set a baseline this season, then aim to beat it next season.
Comparing Water Use by Crop, System, and Climate
Water demand swings by crop species, production system, and climate, but a raw gallon count cannot tell you whether one bed is more efficient than another. To compare fairly, normalize to a common unit of saleable output and a common weather period. The unique angle here is a normalization method competitors leave out: convert every comparison to gallons per stem (or per saleable bunch) per week, then adjust for reference evapotranspiration so climate does not masquerade as inefficiency.
Normalizing the Comparison
- Pick a common output unit. For cut flowers, use gallons per stem harvested. For potted ornamentals, use gallons per saleable unit. For bunches, convert stems to bunches using your standard bunch count so the number is comparable across crops.
- Fix the time window. Compare the same week or the same growth stage, not the whole season. A crop in vegetative growth and the same crop at harvest have very different water demand.
- Adjust for climate with reference evapotranspiration (ET). Reference ET (often written ETo) estimates atmospheric water demand from temperature, humidity, wind, and solar radiation. Divide gallons per stem by the ETo total for the period to get a weather-adjusted figure. Two farms in different climates can then be compared on the same footing.
- Separate system effects. Container production and greenhouse production usually beat field production on gallons per stem because you control every input and capture drainage. Field rows lose more to evaporation and deep percolation. Report the system alongside the number so readers do not treat unlike systems as equivalent.
- Note media and container size. A larger container holds more water and drains more slowly than a small plug, which changes how much of the applied water the crop can use. Record container volume in gallons or inches and media type next to every efficiency figure.
Rainfall offsets irrigation needs in field production, so track it in inches alongside your water logs and subtract effective rainfall before comparing irrigation totals. Because evapotranspiration varies with weather and crop stage, use it to refine irrigation timing and direct water to the root zone, where a Garden Water Ring can help focus delivery.
Worked comparison: a greenhouse zone and a field block both grow the same cut flower and both harvest 400 stems in a week. The greenhouse zone consumes 800 gallons (2.0 gallons per stem); the field block consumes 1,200 gallons (3.0 gallons per stem).
Watch out: comparing gallons per stem across different growth stages will make a young planting look wasteful, because small plants transpire far less than mature ones, so always match stage to stage.
If you are weighing local, organic sourcing, our guide to the benefits of local organic flower buckets explains how regional growing cuts both water miles and supply risk. And for growers adding native species, how to add native wildflowers to professional bouquets covers crop choices that often thrive on less irrigation.
Water Reuse, Recirculation, and Runoff Management
Recirculating irrigation captures runoff and sends it back to the crop. It is the single biggest water saver for greenhouse and container production.
Set up a catchment tank below your benches. Filter the captured water, then blend it back into your irrigation supply. Test recycled water for quality before reuse.
Watch out: recycled water can carry plant pathogens. Filter and test it, or you trade a water saving for a disease problem.
For the bigger picture on the farm, read our guide to sustainable flower farming practices. And if runoff and waste are your focus, our 2026 guide to reducing floral waste walks through the full operation.
Starting Your Water Use Evaluation
Start your water use evaluation with one meter, one clipboard, and one season of data. That is enough to find your biggest losses and set a real baseline.
Evaluating water usage in flower production does not require expensive software. It requires consistency. Log applied water, runoff, and harvest counts every week, and the patterns will surface fast.
If you are sourcing flowers as you build out your plan, our 2026 wholesale flower guide for florists covers selection and supply.
Water is the quiet input that decides whether your stems hold up in the vase.
Frequently Asked Questions
How do you measure water use in flower production?
Install a dedicated water meter on each irrigation line or zone, then log readings before and after every watering event. For container and greenhouse production, weigh a sample of pots before and after irrigation to capture applied water directly. Pair meter data with climate records for rainfall and evapotranspiration so you can separate water applied from water consumed. Rutgers Cooperative Extension advises that thorough water analysis and evaluation come before production decisions, so start with a baseline meter reading and a water quality test.
What is water-use efficiency in floriculture?
Water-use efficiency in flower production compares the water you apply to the yield you get, usually as water per stem, per square foot, or per unit of dry weight. Tracking the ratio over successive harvests shows whether changes to irrigation scheduling or growing media are actually reducing water demand or just shifting it.
How do flower growers calculate irrigation water needs?
Start with crop water requirements from evapotranspiration, then adjust for your production system. The flower production water use formula is: water applied minus water lost to runoff, drainage, and evaporation equals consumptive water use. Root health and algae growth are common irrigation problems, often tied to overwatering. Measure actual application with a meter or catch cans, compare it to crop demand, and adjust scheduling until the gap closes.
How can flower farms reduce irrigation water use?
Three changes deliver most of the savings: fix leaks and uneven emitters, switch to demand-based scheduling using evapotranspiration data, and capture runoff for reuse. Recirculating systems in greenhouse and container production cut freshwater withdrawals directly. Benchmark before and after each change so you can prove the reduction rather than assume it.
